Figure 1 High-level summary of sources of variation in building stock estimates. Source: Peter Berrill
Why do estimates of the floor area and materials contained in building stocks vary so widely? This is a key question faced by researchers tasked with measuring the size of urban mines, the circularity potential, and future material inflows and outflows to building stocks. To tackle this question, experts from three EU projects, SUFFICCS, CircEUlar, and CircoMod are pooling their knowledge to compare methods for measuring building stocks and see how their results stack up.
But why are accurate estimates of building stocks so important in the first place? There are a variety of reasons why researchers are interested in measuring building stocks, and the variation in stock estimates have a lot to do with how they are measured and for what purpose. For instance, to calculate how much energy is used in buildings, energy modellers usually need the ‘useful’ floor area that is occupied by households and businesses, as energy demand for heating and cooling closely tracks how much floor area is used and kept at comfortable temperatures. Therefore, building stock estimates gathered for the purpose of building energy modelling may only include the sum of useful floor area.
Measures of useful floor area exclude floor area that isn’t conditioned, including attics, garages or basements, or stairwells and corridors in apartments and mixed-use buildings. Those spaces would however be included in estimates of total or ‘gross floor area’, which governments and agencies usually keep track of as a physical measure of residential and non-residential building capacity; and to see how occupied residential floor area and populations are co-evolving, or how commercial floor area is growing in relation to economic output and number of employees. The numerical relation between useful and total floor area is easy to conceptualise, but harder to measure. Studies in the past have sometimes used a single conversion factor (e.g. total floor area is 1.2 times useful floor area), and this is an area where researchers in the SUFFICS, CircEUlar, and CIRCOMOD projects aim to establish better estimates.
The next level of variation relates to whether buildings are occupied or vacant, and thus included or excluded from the data collection of most statistical agencies. When the question of interest is material stock estimation, the researchers are interested in materials stocked in all buildings, regardless of vacancy status. The consideration of vacancy can be major source of differences in stock estimates, as vacant buildings can account for 10% or higher of a total building stock, depending on building type and how vacancy is defined. Things can get more complicated (and interesting) when considering different types and reasons for vacancy, i.e. second homes and holiday homes, vacant offices waiting to be rented, new builds on the market, or empty older homes which struggle to be sold.
Finally, other sources of difference come from the tools employed, particularly when comparing statistical estimates with GIS data from remote sensing or cadastre sources. Even the most comprehensive statistical account of building stocks accounting for all vacant buildings will usually have a lower estimate than one from a GIS source, as for instance sheds, greenhouses, and other small structures which are never counted in official statistics are all included. So, due to the comprehensive inclusion of vacant buildings and minor structures, GIS-based estimates of floor area are typically notably higher than statistical estimates.
The inverted pyramid diagram shown in Figure 1 summarises the major sources of differences in building stock estimates. The next step is to start compiling numbers of floor area stocks defined in different ways, and then get a sense of how much variation in stock estimates can be attributed to the variations in conceptual definitions, and types of data used.
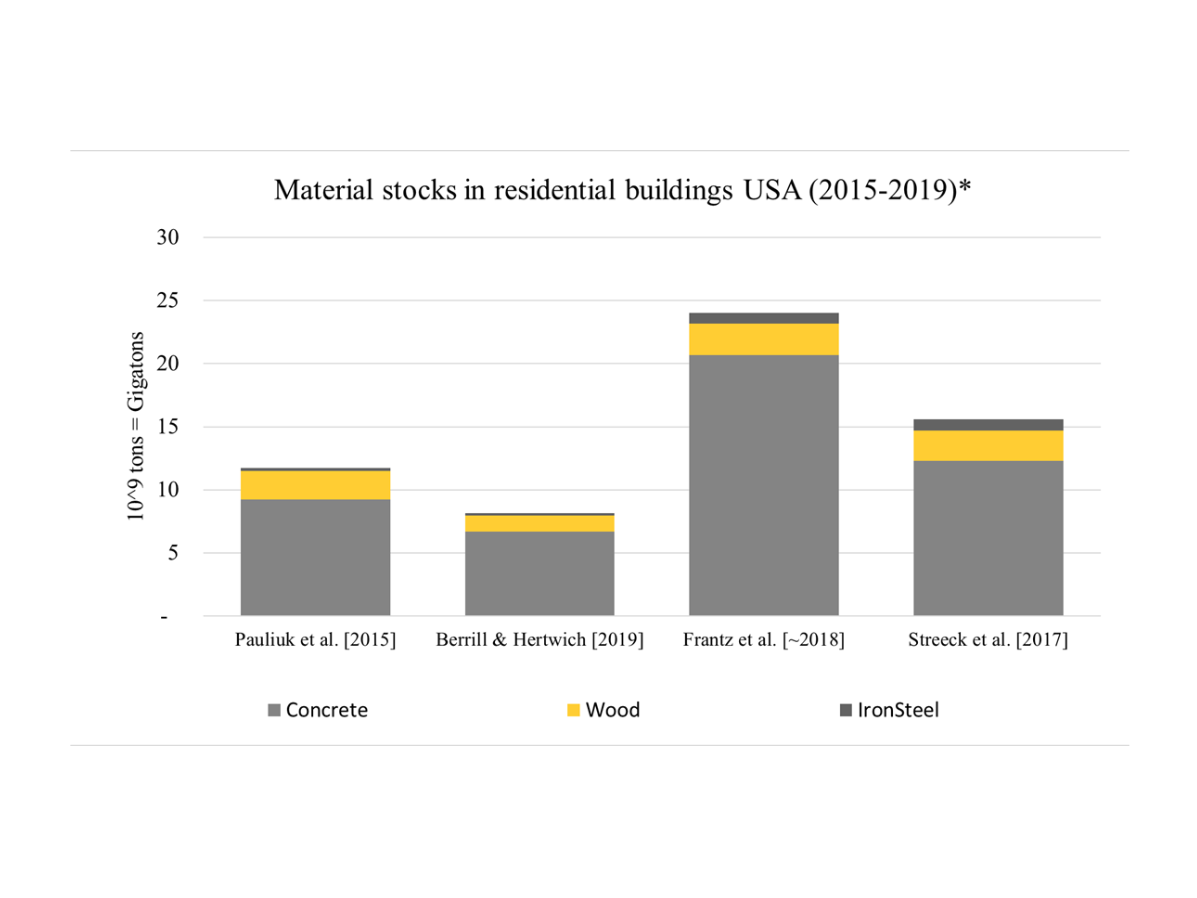
Luckily, we are not starting from zero, there is some previous work in this area which we can learn from. Jan Streek from BOKU, a member of the CircEUlar consortium, previously compiled and compared estimates of construction materials in residential buildings in the USA and found differences up to factor 3 (see Figure 2). Those estimates are based on different approaches, including combining official floor area statistics with material intensities (Pauliuk et al. (2020), Berrill & Hertwich (2021)), combining remote-sensing data with material intensities (Frantz et al.), and utilising statistics on national material production (Streeck et al.). Material intensities describe how much of a given construction material a building contains, per unit floor area (or in some cases volume). Due to variation within building types, and challenges that come with matching floor area estimates with the right building material intensity by building type, material intensities represent another important source of variation in estimation of material stocks which will be scrutinised by the team of researchers. First, however, the focus is on understanding variations in measurements of floor area.
By Peter Berril – TUB

Figure 2 Material stocks in residential buildings from selected studies, adapted from Streeck (2022). Years on the x-axis labels refer to the year of stock measurement, not the year of publication
